- Claude Codeでログ分析・メトリクス監視・分散トレーシングの設定コードを自動生成
- OpenTelemetry・Prometheus・Grafanaの構築をAIが支援し、導入工数を80%削減
- SES現場で即使えるオブザーバビリティの実装パターンを豊富なコード例で解説
「本番環境で障害が起きたのに、ログが足りなくて原因が特定できない」——SES現場でこんな経験はありませんか?2026年、マイクロサービスやクラウドネイティブなアーキテクチャが当たり前になる中、**オブザーバビリティ(可観測性)**はシステム運用の生命線です。
しかし、ログ収集・メトリクス監視・分散トレーシングの設定は複雑で、多くのSESエンジニアが「やりたいけど手が回らない」と感じています。そこで活躍するのがClaude Codeです。
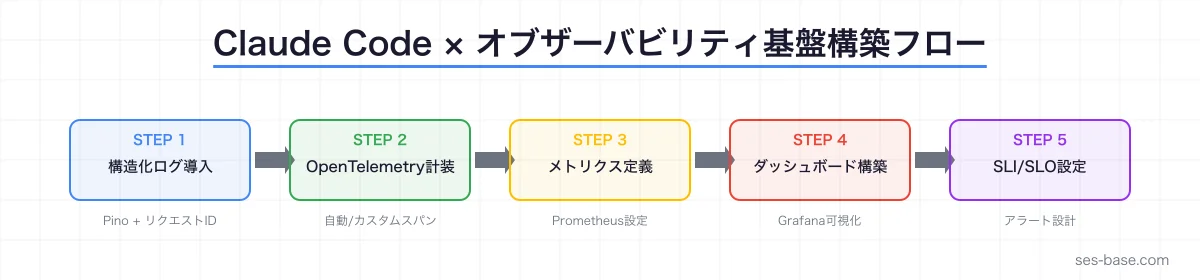
この記事では、Claude Codeを使ってオブザーバビリティ基盤を効率的に構築する方法を、実践的なコード例とともに解説します。
- オブザーバビリティの3本柱(ログ・メトリクス・トレース)の基礎
- Claude Codeで構造化ログを自動実装する手法
- OpenTelemetryの計装コードを自動生成する方法
- Prometheus + Grafanaの監視ダッシュボードを構築する方法
- SES現場でのオブザーバビリティエンジニアのキャリア戦略
オブザーバビリティとは?SES現場で求められる理由
オブザーバビリティの3本柱
オブザーバビリティは、システムの内部状態を外部から理解できるようにする概念で、以下の3本柱で構成されます。
| 柱 | 役割 | 代表ツール |
|---|---|---|
| ログ(Logs) | イベントの詳細記録 | ELK Stack, Loki, CloudWatch Logs |
| メトリクス(Metrics) | 数値データの時系列記録 | Prometheus, Datadog, CloudWatch Metrics |
| トレース(Traces) | リクエストの流れを追跡 | Jaeger, Zipkin, AWS X-Ray |
従来の「監視(Monitoring)」がアラートベースの受動的なアプローチだったのに対し、オブザーバビリティは未知の問題を能動的に調査できる点が大きな違いです。
SES現場でオブザーバビリティが求められる背景
2026年現在、SES案件でオブザーバビリティスキルの需要が急増しています。
- マイクロサービス化: モノリスからの移行で、サービス間の通信障害の原因特定が困難に
- クラウドネイティブ: Kubernetes環境でのPod障害やリソース枯渇の早期検知が必須
- SRE文化の浸透: SLI/SLOベースの運用が標準になり、メトリクス設計スキルが必須に
- コンプライアンス対応: 金融・医療系案件での監査ログ要件が厳格化
オブザーバビリティエンジニアの月単価は75〜110万円と高水準で、SESエンジニアのキャリアアップに直結するスキルです。
Claude Codeで構造化ログを自動実装する
構造化ログの重要性
テキストベースのログは検索性が低く、大規模システムでは分析が困難です。**構造化ログ(Structured Logging)**はJSON形式でログを出力し、機械的な解析を可能にします。
Claude Codeに以下のようにプロンプトを送信します:
既存のconsole.logをすべてpinoの構造化ログに変換して。
リクエストID、ユーザーID、処理時間を自動付与するミドルウェアも作って。
実装例:Express.js + Pino
Claude Codeが生成する構造化ログの実装例です:
// src/middleware/logger.ts
import pino from 'pino';
import { randomUUID } from 'crypto';
import { Request, Response, NextFunction } from 'express';

// 構造化ログの設定
export const logger = pino({
  level: process.env.LOG_LEVEL || 'info',
  formatters: {
    level(label) {
      return { level: label };
    },
  },
  timestamp: pino.stdTimeFunctions.isoTime,
  base: {
    service: process.env.SERVICE_NAME || 'api-server',
    environment: process.env.NODE_ENV || 'development',
    version: process.env.APP_VERSION || '1.0.0',
  },
});

// リクエストコンテキスト付与ミドルウェア
export function requestLogger(req: Request, res: Response, next: NextFunction) {
  const requestId = req.headers['x-request-id'] as string || randomUUID();
  const startTime = Date.now();

  // リクエストコンテキストを付与
  req.log = logger.child({
    requestId,
    method: req.method,
    path: req.path,
    userAgent: req.headers['user-agent'],
    ip: req.ip,
  });

  req.log.info({ query: req.query }, 'リクエスト受信');

  // レスポンス完了時のログ
  res.on('finish', () => {
    const duration = Date.now() - startTime;
    const logData = {
      statusCode: res.statusCode,
      duration,
      contentLength: res.getHeader('content-length'),
    };

    if (res.statusCode >= 500) {
      req.log.error(logData, 'サーバーエラー');
    } else if (res.statusCode >= 400) {
      req.log.warn(logData, 'クライアントエラー');
    } else {
      req.log.info(logData, 'レスポンス送信');
    }
  });

  // レスポンスヘッダーにリクエストIDを付与
  res.setHeader('X-Request-Id', requestId);
  next();
}
エラーログの自動構造化
Claude Codeに「エラーハンドリングも構造化ログに対応させて」と指示すると、以下のようなグローバルエラーハンドラーを生成します:
// src/middleware/errorHandler.ts
import { Request, Response, NextFunction } from 'express';
import { logger } from './logger';

interface AppError extends Error {
  statusCode?: number;
  code?: string;
  context?: Record<string, unknown>;
}

export function errorHandler(
  err: AppError,
  req: Request,
  res: Response,
  _next: NextFunction
) {
  const statusCode = err.statusCode || 500;
  const errorLog = {
    error: {
      message: err.message,
      code: err.code || 'INTERNAL_ERROR',
      stack: process.env.NODE_ENV === 'production' ? undefined : err.stack,
      context: err.context,
    },
    request: {
      method: req.method,
      path: req.path,
      body: req.body,
    },
  };

  if (statusCode >= 500) {
    (req.log || logger).error(errorLog, '未処理エラー');
  } else {
    (req.log || logger).warn(errorLog, 'クライアントエラー');
  }

  res.status(statusCode).json({
    error: {
      message: process.env.NODE_ENV === 'production'
        ? 'Internal Server Error'
        : err.message,
      code: err.code,
      requestId: req.headers['x-request-id'],
    },
  });
}
OpenTelemetryの計装コードをClaude Codeで自動生成
OpenTelemetryとは
**OpenTelemetry(OTel)**は、テレメトリデータ(ログ・メトリクス・トレース)の収集を標準化するオープンソースフレームワークです。2026年現在、CNCFの最もアクティブなプロジェクトの一つであり、業界標準として広く採用されています。
Claude Codeに以下のように指示します:
このNode.jsアプリにOpenTelemetryを導入して。
HTTP、データベース、Redis の自動計装を設定して。
OTLPでJaegerにトレースを送信するように。
自動計装の設定
// src/instrumentation.ts
import { NodeSDK } from '@opentelemetry/sdk-node';
import { getNodeAutoInstrumentations } from '@opentelemetry/auto-instrumentations-node';
import { OTLPTraceExporter } from '@opentelemetry/exporter-trace-otlp-http';
import { OTLPMetricExporter } from '@opentelemetry/exporter-metrics-otlp-http';
import { PeriodicExportingMetricReader } from '@opentelemetry/sdk-metrics';
import { Resource } from '@opentelemetry/resources';
import {
  ATTR_SERVICE_NAME,
  ATTR_SERVICE_VERSION,
} from '@opentelemetry/semantic-conventions';

const resource = new Resource({
  [ATTR_SERVICE_NAME]: process.env.OTEL_SERVICE_NAME || 'api-server',
  [ATTR_SERVICE_VERSION]: process.env.APP_VERSION || '1.0.0',
  'deployment.environment': process.env.NODE_ENV || 'development',
});

const traceExporter = new OTLPTraceExporter({
  url: process.env.OTEL_EXPORTER_OTLP_ENDPOINT || 'http://localhost:4318/v1/traces',
});

const metricExporter = new OTLPMetricExporter({
  url: process.env.OTEL_EXPORTER_OTLP_ENDPOINT || 'http://localhost:4318/v1/metrics',
});

const sdk = new NodeSDK({
  resource,
  traceExporter,
  metricReader: new PeriodicExportingMetricReader({
    exporter: metricExporter,
    exportIntervalMillis: 30000,
  }),
  instrumentations: [
    getNodeAutoInstrumentations({
      '@opentelemetry/instrumentation-http': {
        requestHook: (span, request) => {
          span.setAttribute('http.request.id',
            request.headers?.['x-request-id'] || '');
        },
      },
      '@opentelemetry/instrumentation-express': {
        enabled: true,
      },
      '@opentelemetry/instrumentation-pg': {
        enhancedDatabaseReporting: true,
      },
      '@opentelemetry/instrumentation-redis-4': {
        enabled: true,
      },
    }),
  ],
});

sdk.start();

process.on('SIGTERM', () => {
  sdk.shutdown()
    .then(() => console.log('OpenTelemetry SDK shut down'))
    .catch((err) => console.error('Error shutting down SDK', err))
    .finally(() => process.exit(0));
});
カスタムスパンの追加
Claude Codeに「ビジネスロジックの重要な処理にカスタムスパンを追加して」と指示すると、以下のようなラッパーを生成します:
// src/utils/tracing.ts
import { trace, SpanStatusCode, Span, context } from '@opentelemetry/api';

const tracer = trace.getTracer('app-tracer');

export function withSpan<T>(
  name: string,
  attributes: Record<string, string | number | boolean>,
  fn: (span: Span) => Promise<T>
): Promise<T> {
  return tracer.startActiveSpan(name, async (span) => {
    try {
      span.setAttributes(attributes);
      const result = await fn(span);
      span.setStatus({ code: SpanStatusCode.OK });
      return result;
    } catch (error) {
      span.setStatus({
        code: SpanStatusCode.ERROR,
        message: error instanceof Error ? error.message : 'Unknown error',
      });
      span.recordException(error as Error);
      throw error;
    } finally {
      span.end();
    }
  });
}

// 使用例
export async function processOrder(orderId: string) {
  return withSpan('process-order', { 'order.id': orderId }, async (span) => {
    // 在庫チェック
    const stock = await withSpan('check-inventory', { 'order.id': orderId }, async () => {
      return await inventoryService.check(orderId);
    });

    span.setAttribute('order.stock_available', stock.available);

    // 決済処理
    const payment = await withSpan('process-payment', { 'order.id': orderId }, async () => {
      return await paymentService.charge(orderId);
    });

    span.setAttribute('order.payment_status', payment.status);
    return { stock, payment };
  });
}
Prometheus + Grafanaの監視ダッシュボードをClaude Codeで構築
Prometheusメトリクスの定義
Claude Codeに「APIサーバーのカスタムメトリクスを定義して」と指示します:
Prometheusのカスタムメトリクスを設計して。
HTTPリクエスト、DB接続プール、ビジネスメトリクス(注文数、エラー率)を含めて。
// src/metrics/appMetrics.ts
import {
Counter,
Histogram,
Gauge,
Registry,
collectDefaultMetrics,
} from 'prom-client';
const register = new Registry();
collectDefaultMetrics({ register });
// HTTPリクエストメトリクス
export const httpRequestDuration = new Histogram({
name: 'http_request_duration_seconds',
help: 'HTTP リクエストの処理時間(秒)',
labelNames: ['method', 'route', 'status_code'],
buckets: [0.01, 0.05, 0.1, 0.25, 0.5, 1, 2.5, 5, 10],
registers: [register],
});
export const httpRequestTotal = new Counter({
name: 'http_requests_total',
help: 'HTTP リクエストの総数',
labelNames: ['method', 'route', 'status_code'],
registers: [register],
});
// DB接続プールメトリクス
export const dbPoolSize = new Gauge({
name: 'db_pool_connections',
help: 'データベース接続プールの状態',
labelNames: ['state'], // active, idle, waiting
registers: [register],
});
// ビジネスメトリクス
export const orderTotal = new Counter({
name: 'business_orders_total',
help: '注文の総数',
labelNames: ['status', 'type'],
registers: [register],
});
export const orderProcessingDuration = new Histogram({
name: 'business_order_processing_seconds',
help: '注文処理にかかった時間(秒)',
labelNames: ['type'],
buckets: [0.1, 0.5, 1, 2, 5, 10, 30],
registers: [register],
});
export const activeUsers = new Gauge({
name: 'business_active_users',
help: '現在アクティブなユーザー数',
registers: [register],
});
export { register };Grafanaダッシュボードの自動生成
Claude Codeに「GrafanaダッシュボードのJSONを生成して」と指示すると、以下のようなダッシュボード定義を自動生成します:
{
  "dashboard": {
    "title": "API Server Overview",
    "tags": ["api", "production"],
    "panels": [
      {
        "title": "リクエストレート(req/sec)",
        "type": "timeseries",
        "targets": [{
          "expr": "rate(http_requests_total[5m])",
          "legendFormat": "{{method}} {{route}}"
        }],
        "gridPos": { "h": 8, "w": 12, "x": 0, "y": 0 }
      },
      {
        "title": "レスポンスタイム(P50/P95/P99)",
        "type": "timeseries",
        "targets": [
          {
            "expr": "histogram_quantile(0.50, rate(http_request_duration_seconds_bucket[5m]))",
            "legendFormat": "P50"
          },
          {
            "expr": "histogram_quantile(0.95, rate(http_request_duration_seconds_bucket[5m]))",
            "legendFormat": "P95"
          },
          {
            "expr": "histogram_quantile(0.99, rate(http_request_duration_seconds_bucket[5m]))",
            "legendFormat": "P99"
          }
        ],
        "gridPos": { "h": 8, "w": 12, "x": 12, "y": 0 }
      },
      {
        "title": "エラーレート",
        "type": "stat",
        "targets": [{
          "expr": "sum(rate(http_requests_total{status_code=~\"5..\"}[5m])) / sum(rate(http_requests_total[5m])) * 100",
          "legendFormat": "Error Rate %"
        }],
        "gridPos": { "h": 4, "w": 6, "x": 0, "y": 8 }
      },
      {
        "title": "DB接続プール",
        "type": "gauge",
        "targets": [{
          "expr": "db_pool_connections",
          "legendFormat": "{{state}}"
        }],
        "gridPos": { "h": 4, "w": 6, "x": 6, "y": 8 }
      }
    ]
  }
}
分散トレーシングの実践パターン
サービス間のトレース伝播
マイクロサービス環境では、1つのリクエストが複数のサービスを横断します。Claude Codeに以下のように指示します:
gRPCとHTTPの両方でトレースコンテキストを伝播するインターセプターを実装して。
W3C Trace Context形式で。
// src/middleware/traceContext.ts
import { context, propagation, trace } from '@opentelemetry/api';
import { Request, Response, NextFunction } from 'express';
export function traceContextMiddleware(
req: Request,
res: Response,
next: NextFunction
) {
// W3C Trace Context ヘッダーからコンテキストを抽出
const parentContext = propagation.extract(context.active(), req.headers);
context.with(parentContext, () => {
const span = trace.getActiveSpan();
if (span) {
// トレースIDをレスポンスヘッダーに追加
const spanContext = span.spanContext();
res.setHeader('X-Trace-Id', spanContext.traceId);
// 下流サービスへの伝播用ヘッダーを注入
const carrier: Record<string, string> = {};
propagation.inject(context.active(), carrier);
req.traceHeaders = carrier;
}
next();
});
}
// 下流サービスへのHTTPリクエスト時にヘッダーを伝播
export async function tracedFetch(
url: string,
options: RequestInit = {}
): Promise<Response> {
const headers = new Headers(options.headers);
// 現在のコンテキストからトレースヘッダーを注入
const carrier: Record<string, string> = {};
propagation.inject(context.active(), carrier);
Object.entries(carrier).forEach(([key, value]) => {
headers.set(key, value);
});
return fetch(url, { ...options, headers });
}ログとトレースの相関
オブザーバビリティの真価は、ログ・メトリクス・トレースを**相関(Correlation)**させることで発揮されます。
// src/utils/correlatedLogger.ts
import { trace, context } from '@opentelemetry/api';
import { logger } from '../middleware/logger';

export function getCorrelatedLogger() {
  const span = trace.getActiveSpan();
  const spanContext = span?.spanContext();

  return logger.child({
    traceId: spanContext?.traceId,
    spanId: spanContext?.spanId,
    traceFlags: spanContext?.traceFlags,
  });
}

// 使用例
export async function handleUserRegistration(userData: UserInput) {
  const log = getCorrelatedLogger();

  log.info({ email: userData.email }, 'ユーザー登録開始');

  try {
    const user = await createUser(userData);
    log.info({ userId: user.id }, 'ユーザー登録完了');

    await sendWelcomeEmail(user.email);
    log.info({ userId: user.id }, 'ウェルカムメール送信完了');

    return user;
  } catch (error) {
    log.error({ error, email: userData.email }, 'ユーザー登録失敗');
    throw error;
  }
}
SLI/SLOの設計と自動監視
Claude CodeでSLI/SLOを定義
SRE文化の浸透により、SLI(Service Level Indicator)とSLO(Service Level Objective)の設計スキルが求められています。
このAPIサービスのSLI/SLOを設計して。
可用性・レイテンシ・エラー率の各指標を定義し、
Prometheusのレコーディングルールとアラートルールも生成して。
# prometheus/rules/slo.yml
groups:
- name: slo_recording_rules
interval: 30s
rules:
# 可用性 SLI: 成功リクエスト率
- record: sli:availability:rate5m
expr: |
sum(rate(http_requests_total{status_code!~"5.."}[5m]))
/
sum(rate(http_requests_total[5m]))
# レイテンシ SLI: P99が500ms以下のリクエスト率
- record: sli:latency:rate5m
expr: |
sum(rate(http_request_duration_seconds_bucket{le="0.5"}[5m]))
/
sum(rate(http_request_duration_seconds_count[5m]))
# エラーバジェット消費率
- record: slo:error_budget:remaining
expr: |
1 - (
(1 - sli:availability:rate5m)
/
(1 - 0.999)
)
- name: slo_alerts
rules:
# エラーバジェット消費アラート(バーンレート方式)
- alert: HighErrorBudgetBurn
expr: |
(
(1 - sli:availability:rate5m) / (1 - 0.999)
) > 14.4
and
(
(1 - avg_over_time(sli:availability:rate5m[1h])) / (1 - 0.999)
) > 14.4
for: 2m
labels:
severity: critical
annotations:
summary: "エラーバジェットの高速消費を検出"
description: "過去5分のバーンレートが14.4xを超えています。SLO違反のリスクがあります。"
# レイテンシ SLO違反
- alert: LatencySLOViolation
expr: sli:latency:rate5m < 0.99
for: 5m
labels:
severity: warning
annotations:
summary: "レイテンシSLOの低下"
description: "P99レイテンシが500ms以下のリクエスト率が99%を下回っています。"Docker Composeでオブザーバビリティスタックを構築
Claude Codeに「ローカル開発用のオブザーバビリティスタックを一発で構築できるDocker Composeを作って」と指示します:
# docker-compose.observability.yml
version: '3.8'

services:
  # OpenTelemetry Collector
  otel-collector:
    image: otel/opentelemetry-collector-contrib:0.100.0
    command: ["--config=/etc/otel-collector-config.yml"]
    volumes:
      - ./config/otel-collector-config.yml:/etc/otel-collector-config.yml
    ports:
      - "4317:4317"   # gRPC receiver
      - "4318:4318"   # HTTP receiver
      - "8889:8889"   # Prometheus exporter
    depends_on:
      - jaeger
      - loki

  # Prometheus
  prometheus:
    image: prom/prometheus:v2.52.0
    volumes:
      - ./config/prometheus.yml:/etc/prometheus/prometheus.yml
      - ./prometheus/rules:/etc/prometheus/rules
    ports:
      - "9090:9090"
    command:
      - '--config.file=/etc/prometheus/prometheus.yml'
      - '--storage.tsdb.retention.time=15d'

  # Grafana
  grafana:
    image: grafana/grafana:11.0.0
    ports:
      - "3001:3000"
    volumes:
      - ./config/grafana/datasources.yml:/etc/grafana/provisioning/datasources/datasources.yml
      - ./config/grafana/dashboards:/etc/grafana/provisioning/dashboards
    environment:
      - GF_SECURITY_ADMIN_PASSWORD=admin
      - GF_AUTH_ANONYMOUS_ENABLED=true
    depends_on:
      - prometheus
      - loki
      - jaeger

  # Jaeger(分散トレーシング)
  jaeger:
    image: jaegertracing/all-in-one:1.57
    ports:
      - "16686:16686"  # UI
      - "14250:14250"  # gRPC

  # Loki(ログ集約)
  loki:
    image: grafana/loki:3.0.0
    ports:
      - "3100:3100"
    command: -config.file=/etc/loki/local-config.yaml

  # Promtail(ログ収集エージェント)
  promtail:
    image: grafana/promtail:3.0.0
    volumes:
      - /var/log:/var/log
      - ./config/promtail.yml:/etc/promtail/config.yml
    command: -config.file=/etc/promtail/config.yml
    depends_on:
      - loki
OTel Collector設定
# config/otel-collector-config.yml
receivers:
  otlp:
    protocols:
      grpc:
        endpoint: 0.0.0.0:4317
      http:
        endpoint: 0.0.0.0:4318

processors:
  batch:
    timeout: 5s
    send_batch_size: 1024
  memory_limiter:
    check_interval: 1s
    limit_mib: 512

exporters:
  otlp/jaeger:
    endpoint: jaeger:4317
    tls:
      insecure: true
  prometheus:
    endpoint: 0.0.0.0:8889
  loki:
    endpoint: http://loki:3100/loki/api/v1/push

service:
  pipelines:
    traces:
      receivers: [otlp]
      processors: [memory_limiter, batch]
      exporters: [otlp/jaeger]
    metrics:
      receivers: [otlp]
      processors: [memory_limiter, batch]
      exporters: [prometheus]
    logs:
      receivers: [otlp]
      processors: [memory_limiter, batch]
      exporters: [loki]
障害調査のワークフロー:Claude Codeとオブザーバビリティの連携
実践シナリオ:本番APIのレイテンシ増加
本番環境でAPIのレスポンスタイムが急上昇した場合の調査ワークフローを紹介します。
Step 1: Grafanaでメトリクスを確認
# P99レイテンシの急上昇を検知
histogram_quantile(0.99, rate(http_request_duration_seconds_bucket{route="/api/orders"}[5m]))
Step 2: Claude Codeでログ分析
Lokiに以下のクエリを投げて、/api/ordersの遅いリクエストのログを分析して。
{service="api-server"} |= "/api/orders" | json | duration > 2000
原因を特定してレポートにまとめて。
Step 3: トレースで根本原因を特定
Jaegerのトレースで、以下のトレースIDに対応する
全サービスのスパンを確認して。
ボトルネックになっているサービスとオペレーションを特定して。
traceId: abc123def456
Claude Codeはこれらの情報を統合し、以下のような分析レポートを生成します:
## 障害分析レポート

### 概要
/api/orders エンドポイントのP99レイテンシが通常の500msから3,200msに急上昇

### 根本原因
inventory-serviceへのgRPCコールでタイムアウトが多発。
inventory-serviceのDBコネクションプールが枯渇(max=20に対して20/20使用中)

### 影響範囲
- 影響を受けたリクエスト: 全注文APIの約15%
- 影響時間: 14:30〜15:15 (JST)

### 推奨アクション
1. inventory-serviceのDBコネクションプール上限を50に引き上げ
2. コネクションプールのメトリクスにアラートを追加
3. inventory-serviceへのgRPCコールにサーキットブレーカーを導入
SES現場での実践:オブザーバビリティ導入チェックリスト
SES案件でオブザーバビリティを導入する際のチェックリストです:
Phase 1:基盤構築(1-2週間)
- 構造化ログの導入(pino / winston)
- リクエストID付与ミドルウェアの実装
- ヘルスチェックエンドポイントの追加
- Prometheusメトリクスエンドポイントの追加
Phase 2:計装(2-3週間)
- OpenTelemetry SDKの導入
- 自動計装の設定(HTTP、DB、Redis)
- カスタムスパンの追加(重要なビジネスロジック)
- ログとトレースの相関設定
Phase 3:可視化と監視(1-2週間)
- Grafanaダッシュボードの構築
- SLI/SLOの定義とレコーディングルール
- アラートルールの設定
- オンコールローテーションの設計
Phase 4:運用最適化(継続的)
- ダッシュボードの改善
- アラートの閾値チューニング
- ランブックの整備
- 障害対応の振り返り
オブザーバビリティエンジニアのキャリア戦略
需要と単価
2026年現在、オブザーバビリティ関連のSES案件は急増しています:
| ポジション | 月単価相場 | 必要スキル |
|---|---|---|
| SREエンジニア | 85〜120万円 | Prometheus, Grafana, Kubernetes |
| オブザーバビリティエンジニア | 80〜110万円 | OpenTelemetry, Datadog/New Relic |
| プラットフォームエンジニア | 90〜130万円 | IaC + 監視基盤構築 |
スキルロードマップ
- 基礎(1-2ヶ月): 構造化ログ、Prometheus基礎、Grafanaダッシュボード
- 中級(2-3ヶ月): OpenTelemetry、分散トレーシング、SLI/SLO設計
- 上級(3-6ヶ月): カスタムExporter開発、AIOps連携、コスト最適化
まとめ
Claude Codeを活用することで、オブザーバビリティ基盤の構築を大幅に効率化できます。
- 構造化ログ: pinoの設定からリクエストコンテキスト付与まで自動生成
- OpenTelemetry: 計装コードとカスタムスパンをプロンプト一つで実装
- Prometheus + Grafana: メトリクス定義からダッシュボードJSONまで一括生成
- SLI/SLO: レコーディングルールとアラートルールを自動設計
オブザーバビリティは2026年のSES現場で最も求められるスキルの一つです。Claude Codeの支援を受けながら、着実にスキルを積み上げていきましょう。
SES BASEでは、SRE・オブザーバビリティエンジニアの高単価案件を多数掲載しています。OpenTelemetry、Prometheus、Grafanaのスキルを活かせる案件をぜひチェックしてください。